The Bollinger Bands indicator is used to calculate market volatility. More precisely it tells us whether the markets are being silent or loud.
The bollinger bands is created by drawing a Moving Average and then an upper and lower band is plotted . (If you wish to know more about the mathematics and formulas for creating the bands you can check www.bollingerbands.com.)
The narrower the bands interval is the more silent the market is, while as the bands get wider the market is about to get explode and become more volatile.
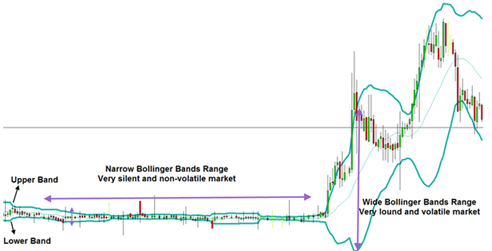
It can be seen in the chart above that while the Bands length is narrow trading is consolidated in a small range. Later on as the Bands open up and get wider it can be seen how the market starts becoming very loud, volatile and moves to the upside.
Using the Bollinger Bounce
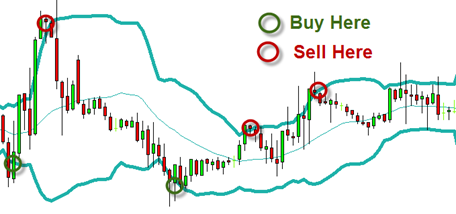
One of the principles of the Bollinger Bands is that the market price will return to the middle of the Bands (the Moving Average price). Therefore you can use this as follows.
Buy when the market price hits and bounces up at the lower band.
Sell when the market price hits and bounces down at the upper band.