

Trend Wave Extreme Analysis 2024.04.25
Report generated at 2024.04.25 10:49 GMT+ 3
Check Here How to Read The Trend Wave Extreme Signals
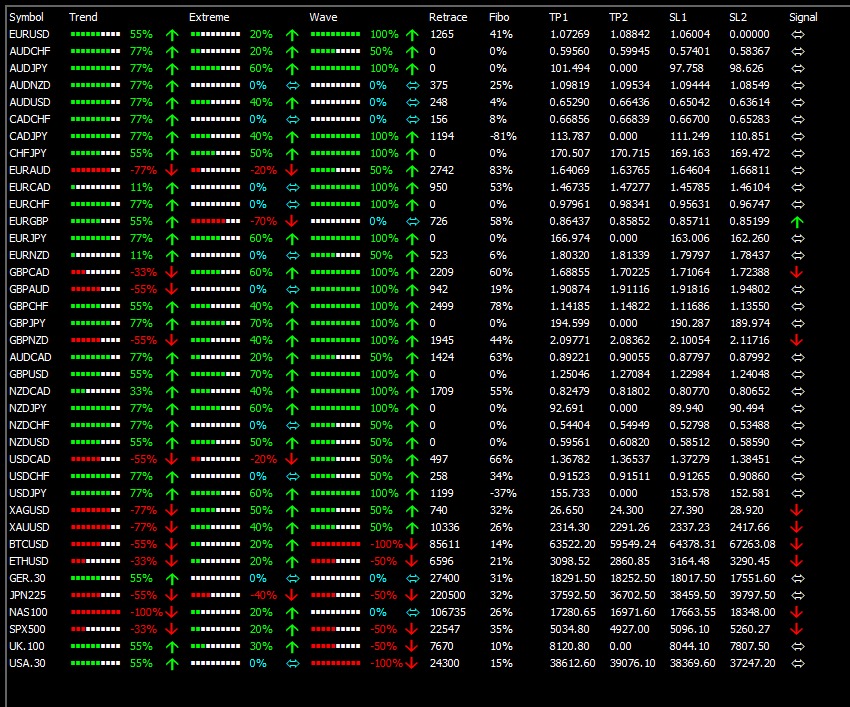
EURGBP Buy (H4)
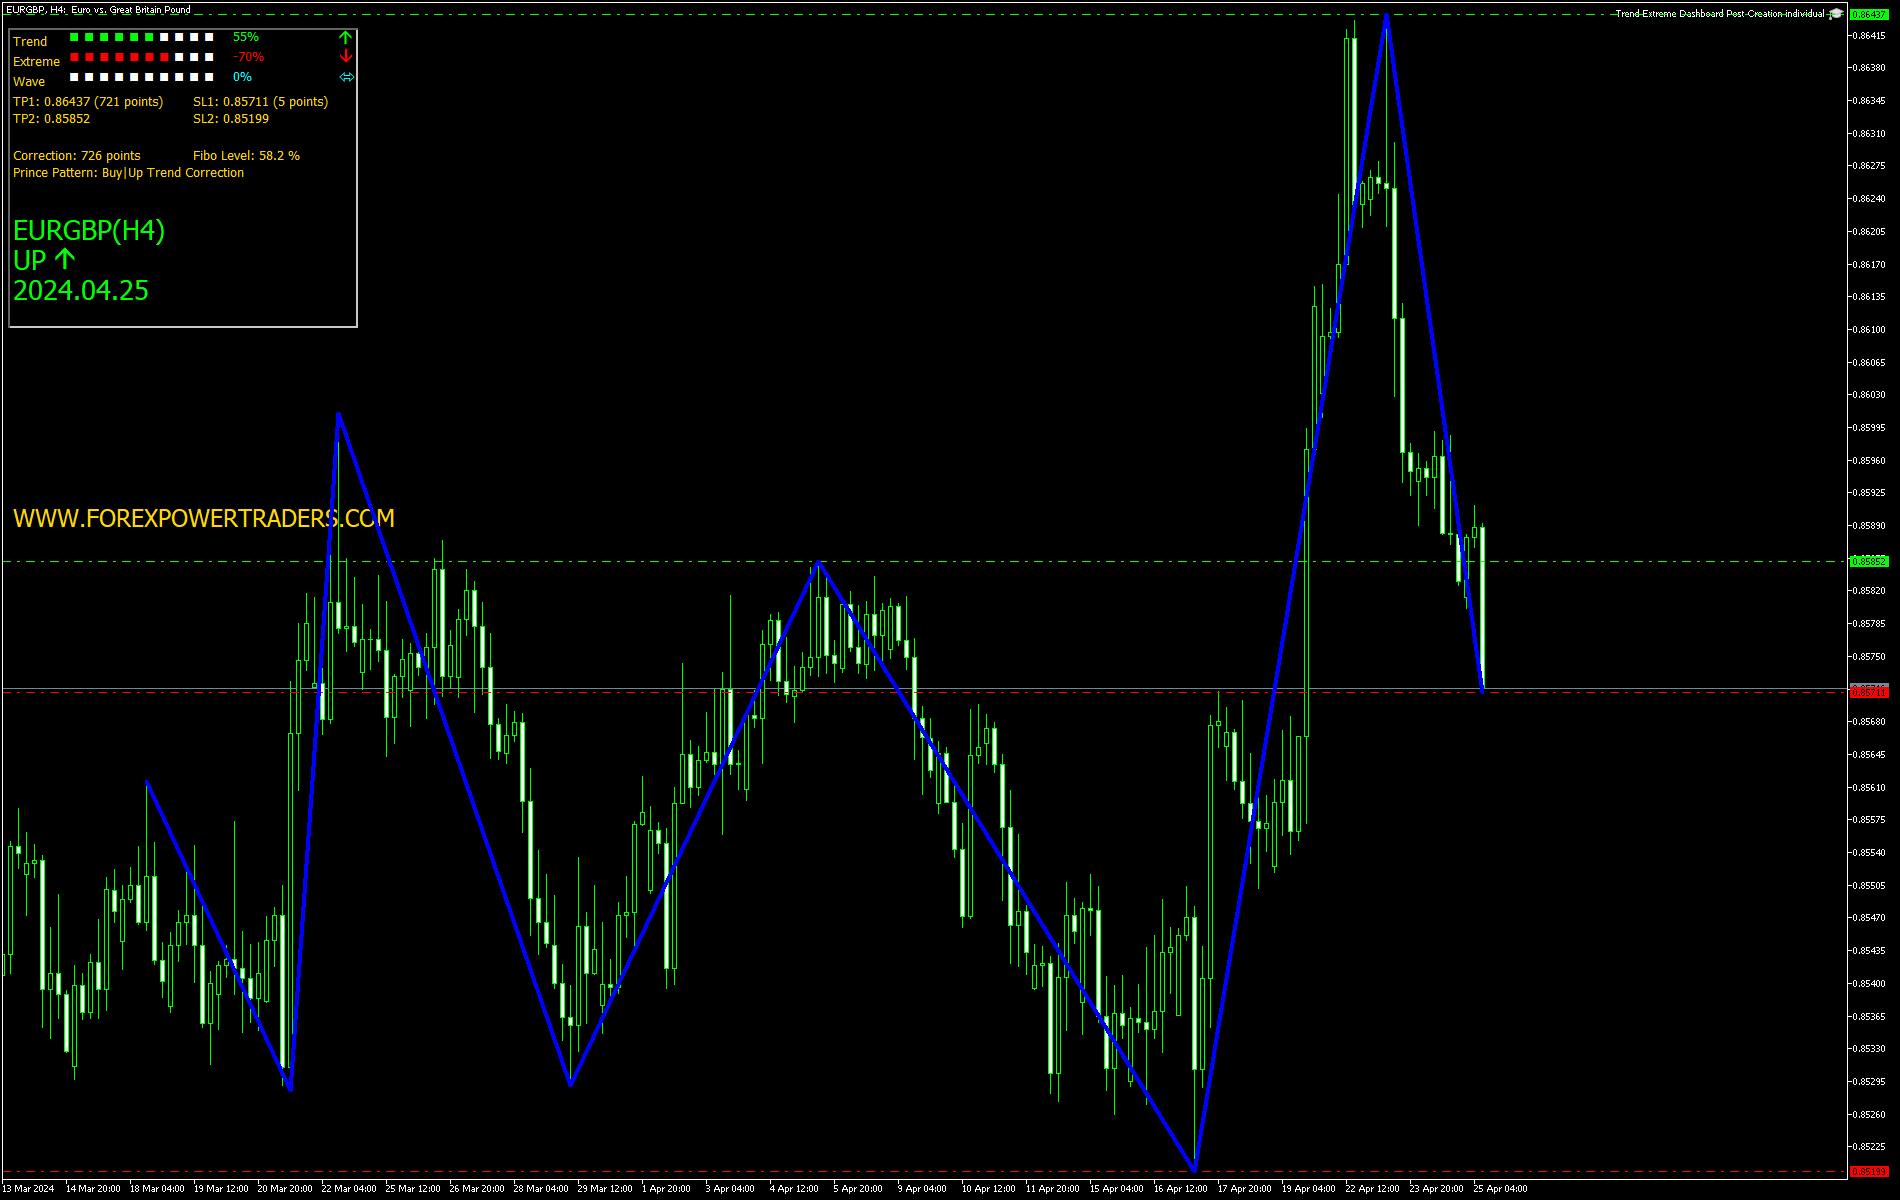
- Trend Bar is Green filled at a level of 55% showing Up trend.
- Wave Bar is Neutral showing the Up correction should be ending
- Extreme Bar is OverSold Red filled at a level of -70% showing a Down correction that may be finishing.
- Correction so far has been 56.70% 708 points.
- Possible Take Profit 0.86437/0.85852
- Possible Stop Loss 0.85729/0.85199
GBPCAD Sell (H4)
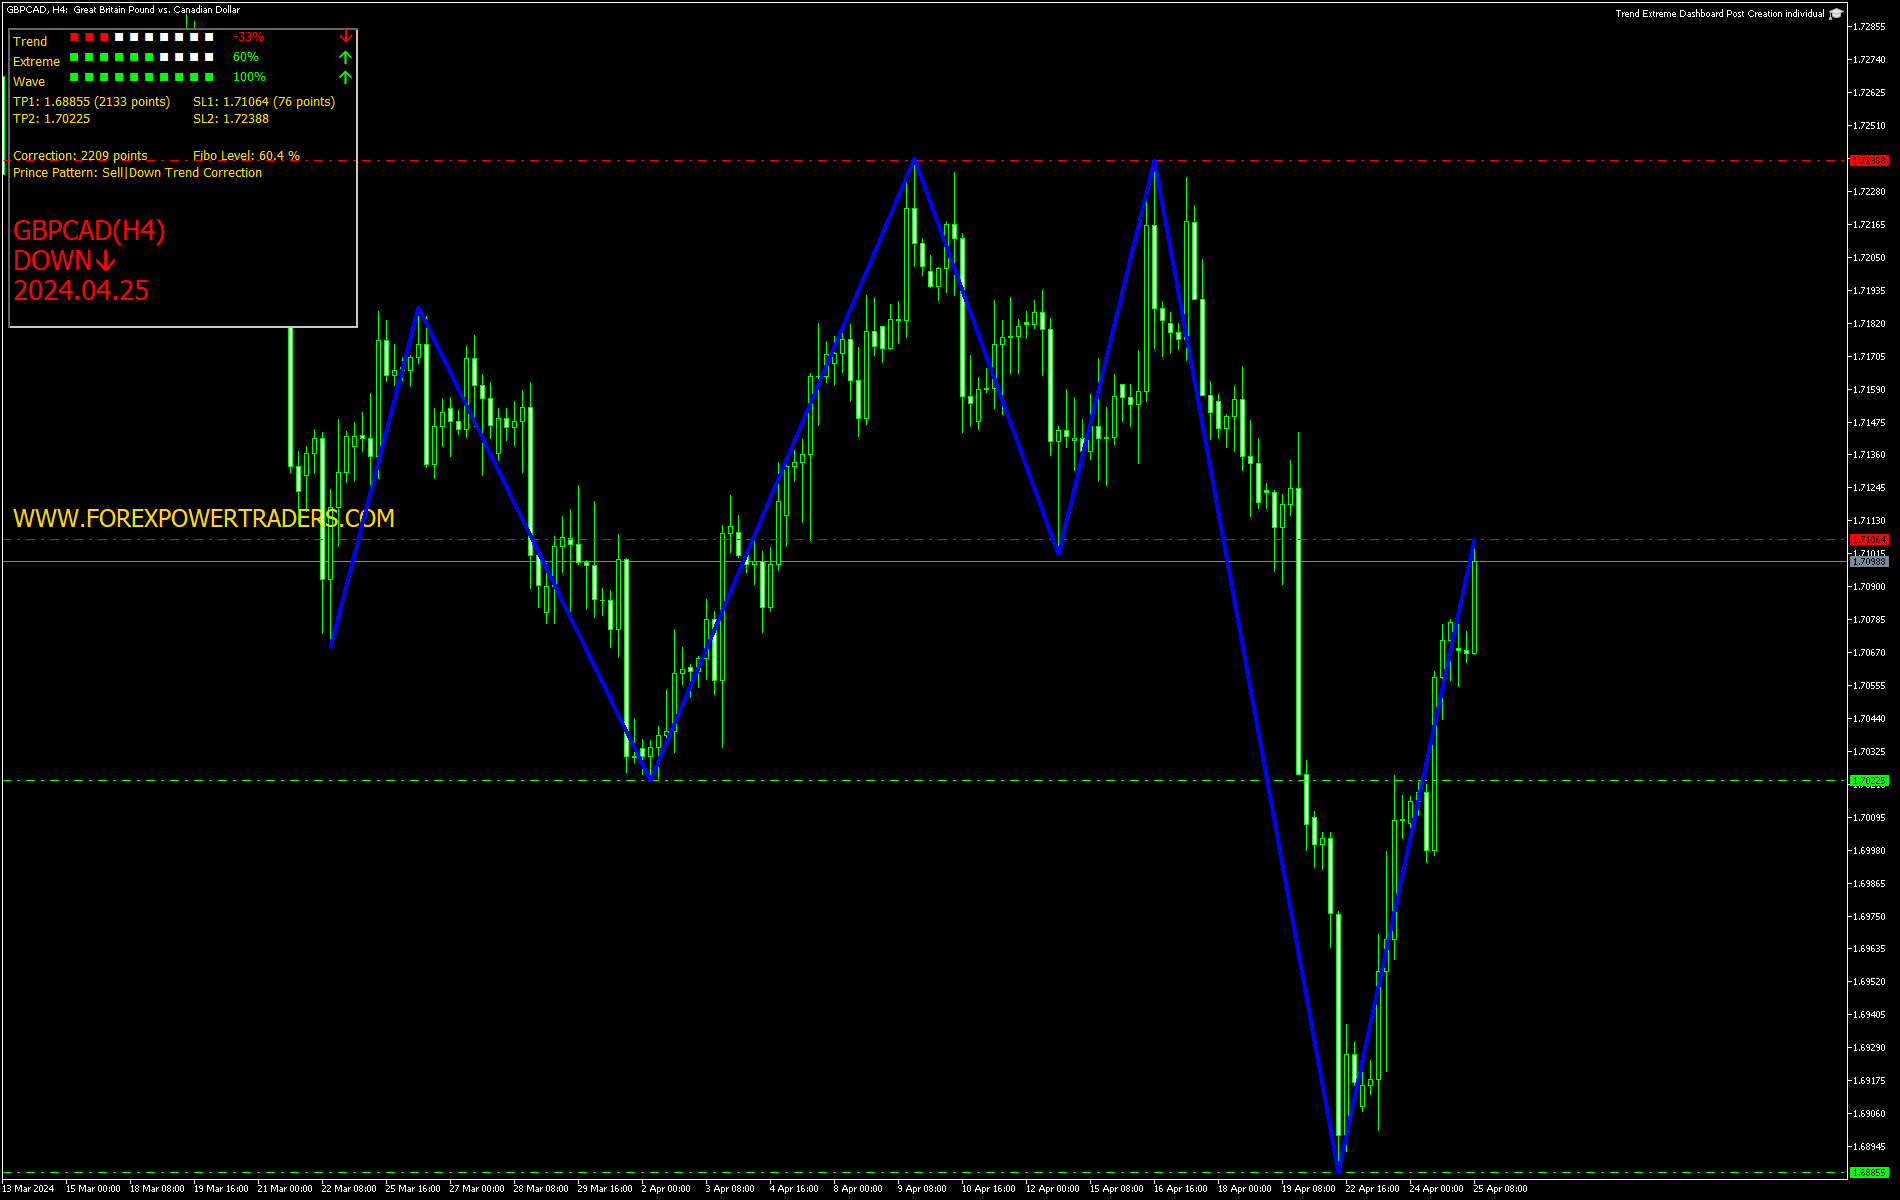
- Trend Bar is Red filled at a level of -33% showing Down trend.
- Wave and Extreme Bars are Green filled showing an Up correction should be ending.
- Correction so far has been 58.65% 2209 points.
- Possible Take Profit 1.68855/1.70225
- Possible Stop Loss 1.71064/1.72388
GBPNZD Sell (H4)
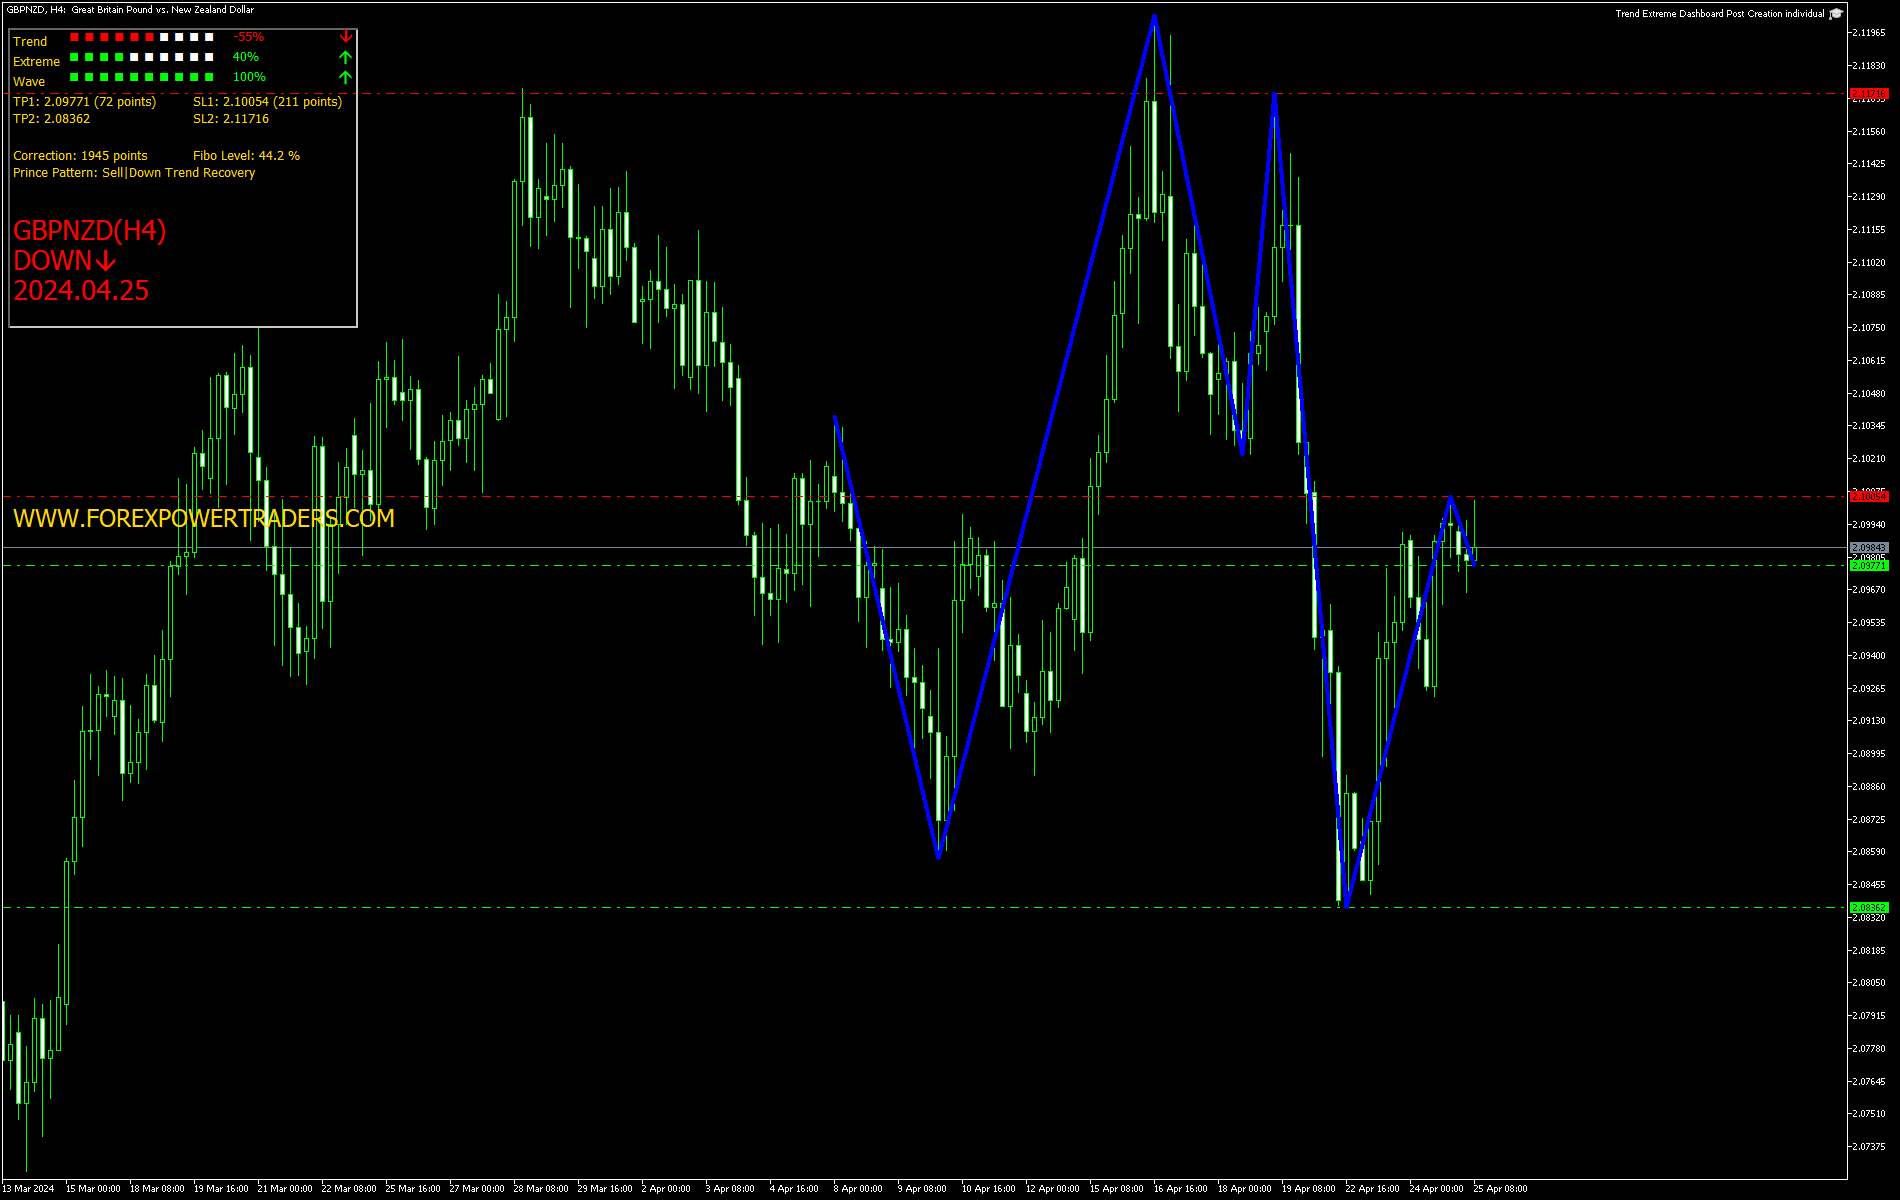
- Trend Bar is Red filled at a level of -55% showing Down trend.
- Wave and Extreme Bars are Green filled showing an Up correction should be ending.
- Correction so far has been 45.23% 1945 points.
- Possible Take Profit 2.09771/2.08362
- Possible Stop Loss 2.10054/2.11716
XAGUSD Sell (H4)
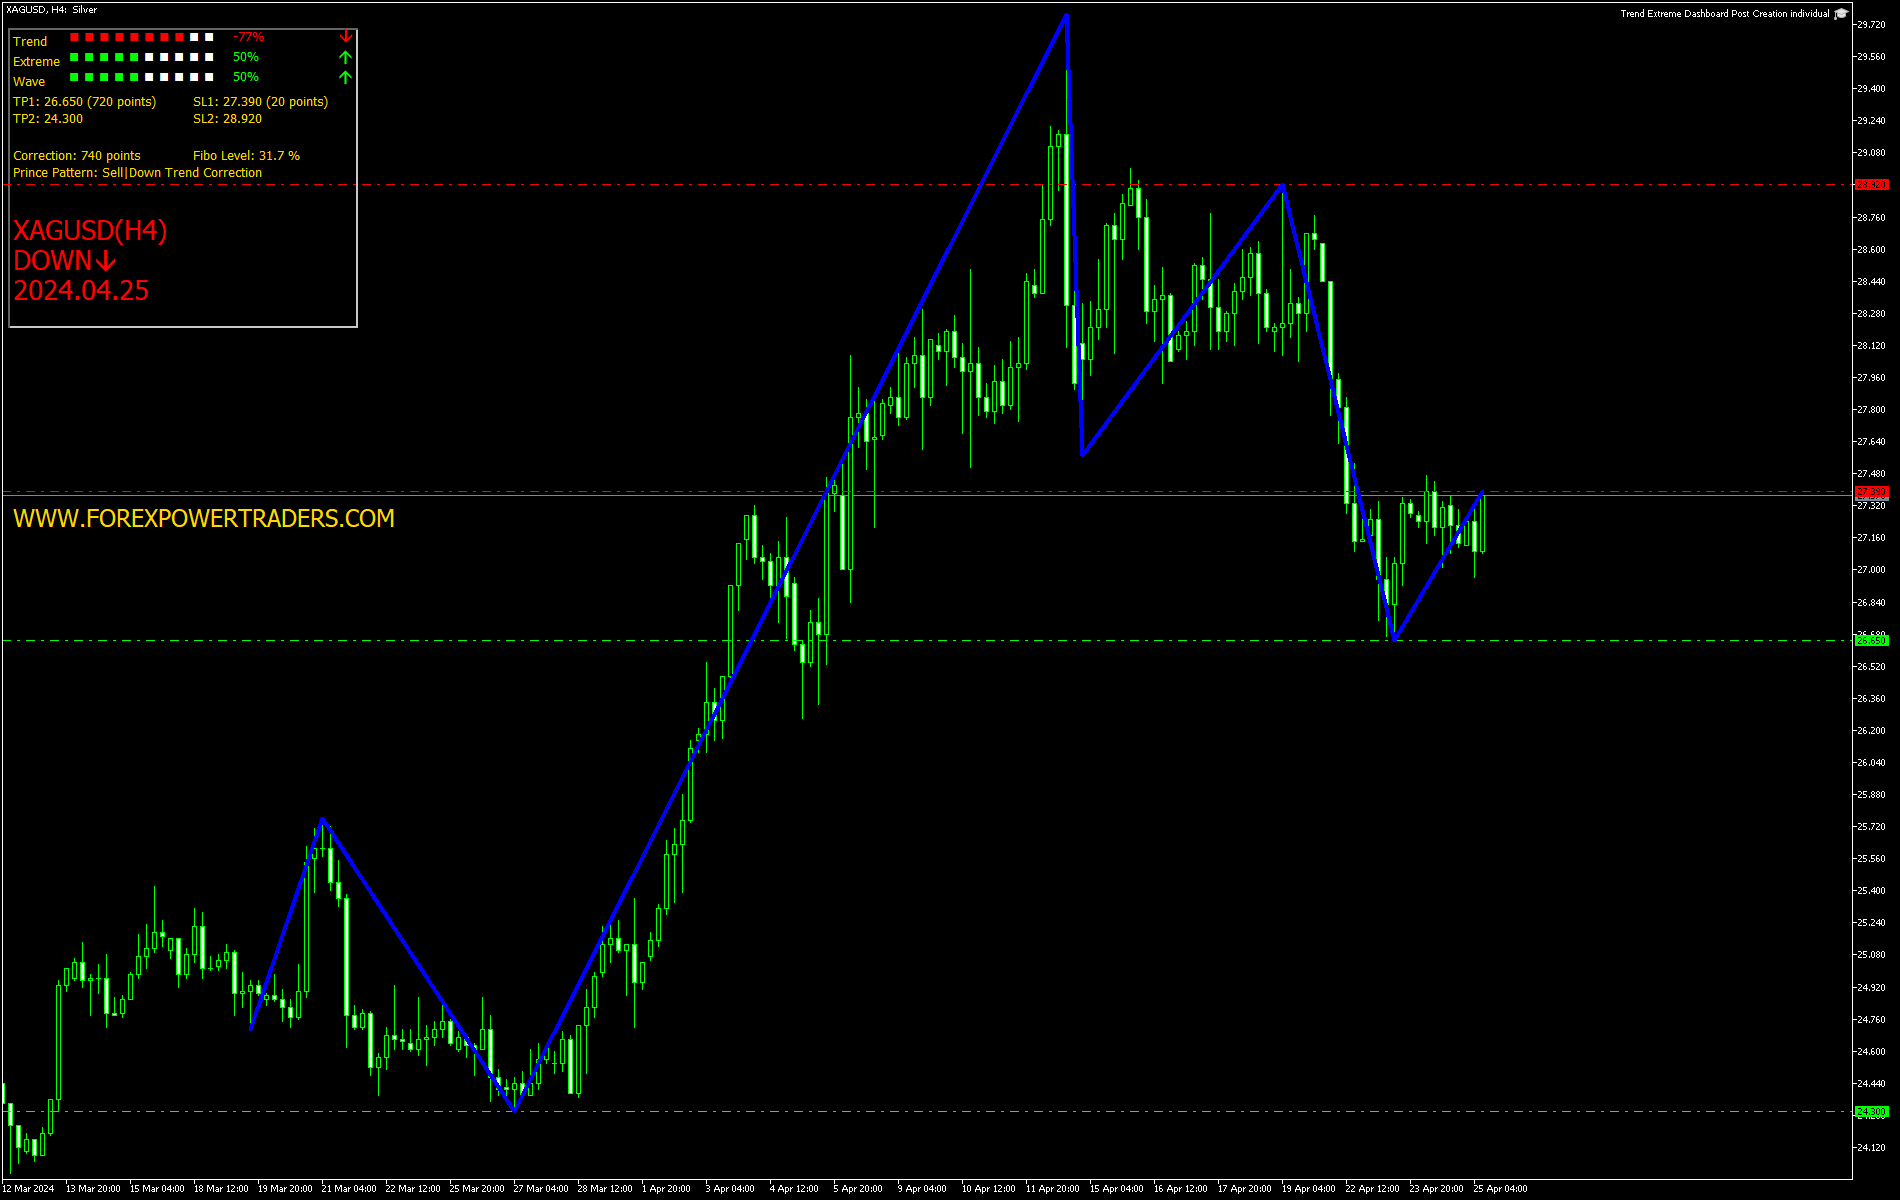
- Trend Bar is Red filled at a level of -77% showing Down trend.
- Wave and Extreme Bars are Green filled showing an Up correction should be ending.
- Correction so far has been 31.28% 710 points.
- Possible Take Profit 26.650/24.300
- Possible Stop Loss 28.920/29.770
XAUUSD Sell (H4)
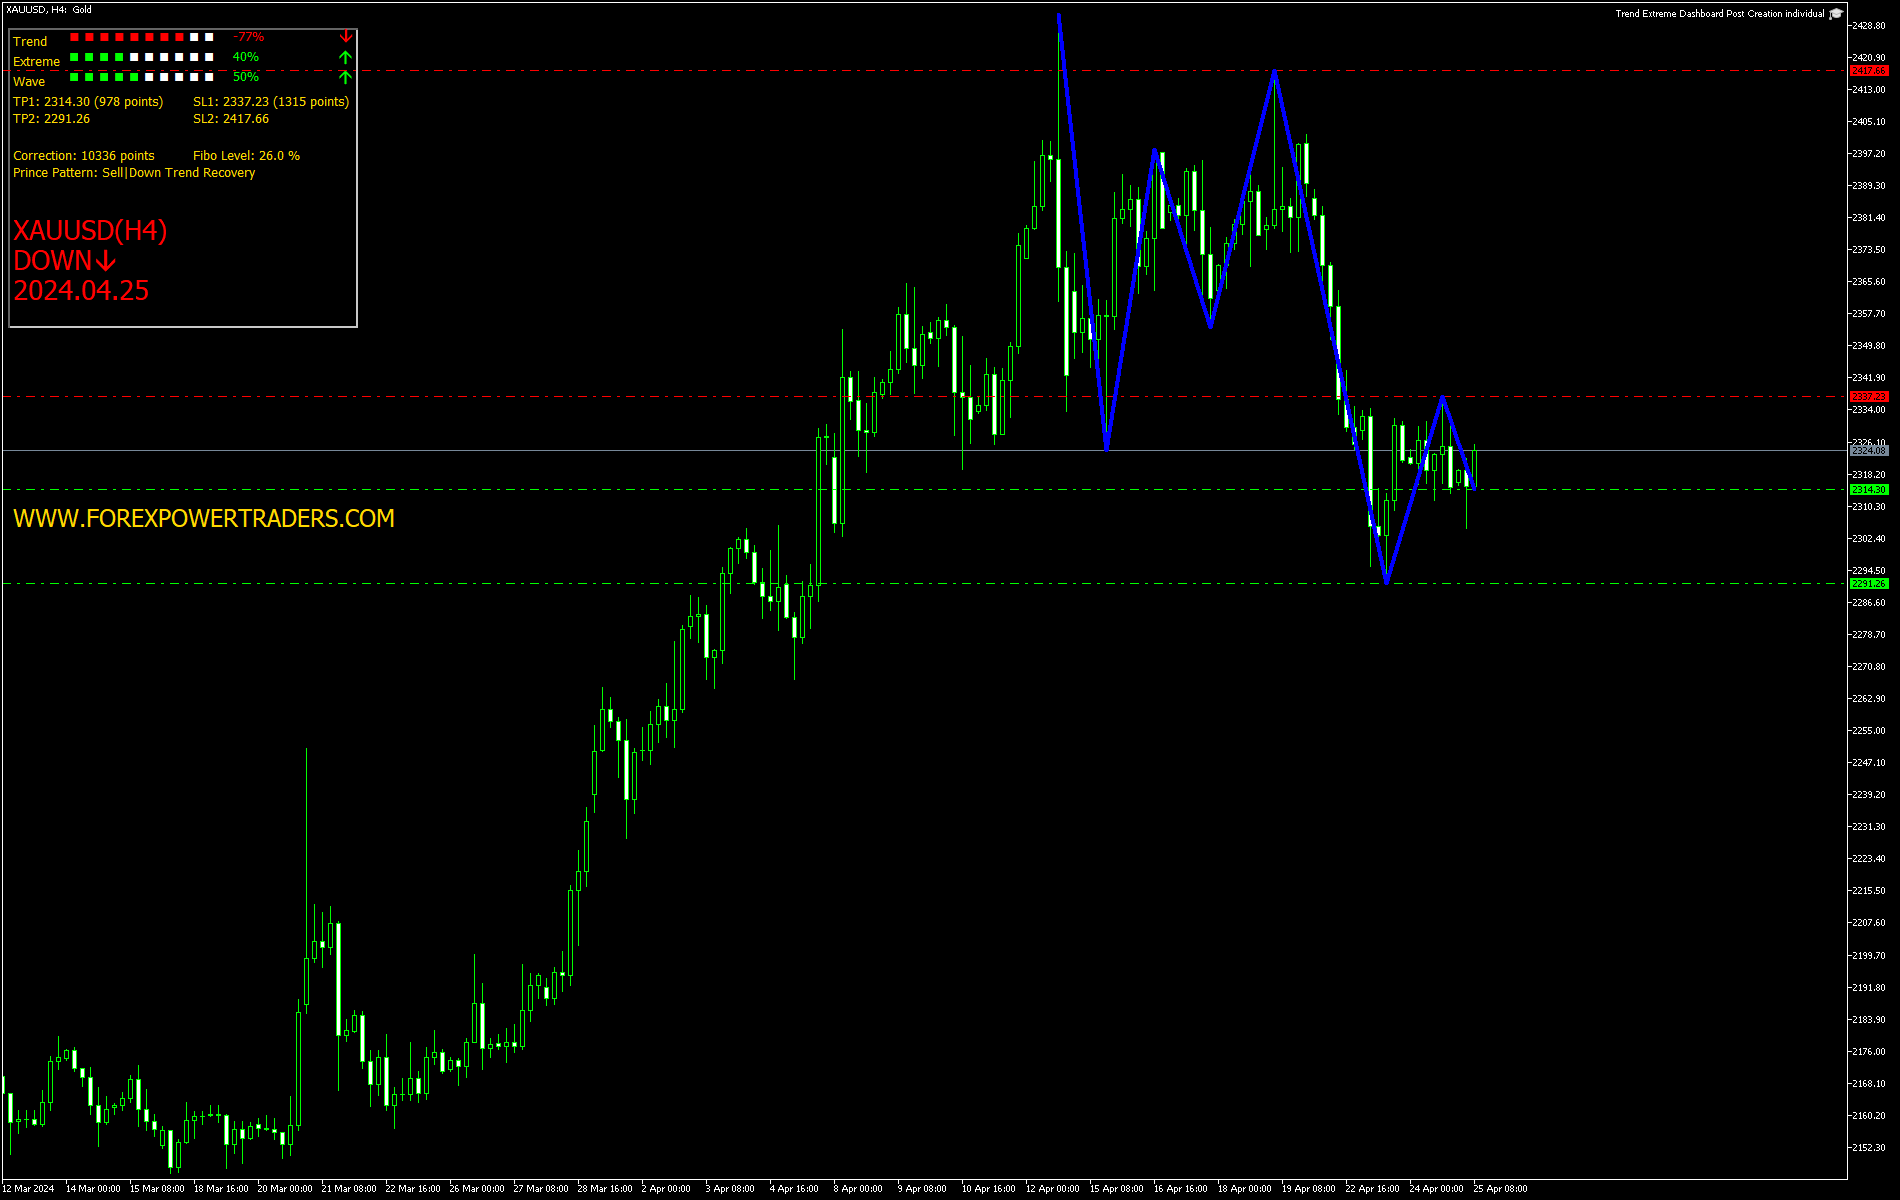
- Trend Bar is Red filled at a level of -77% showing Down trend.
- Wave and Extreme Bars are Green filled showing an Up correction should be ending.
- Correction so far has been 25.34% 10336 points.
- Possible Take Profit 2314.30/2291.26
- Possible Stop Loss 2337.23/2417.66
BTCUSD Sell (H4)
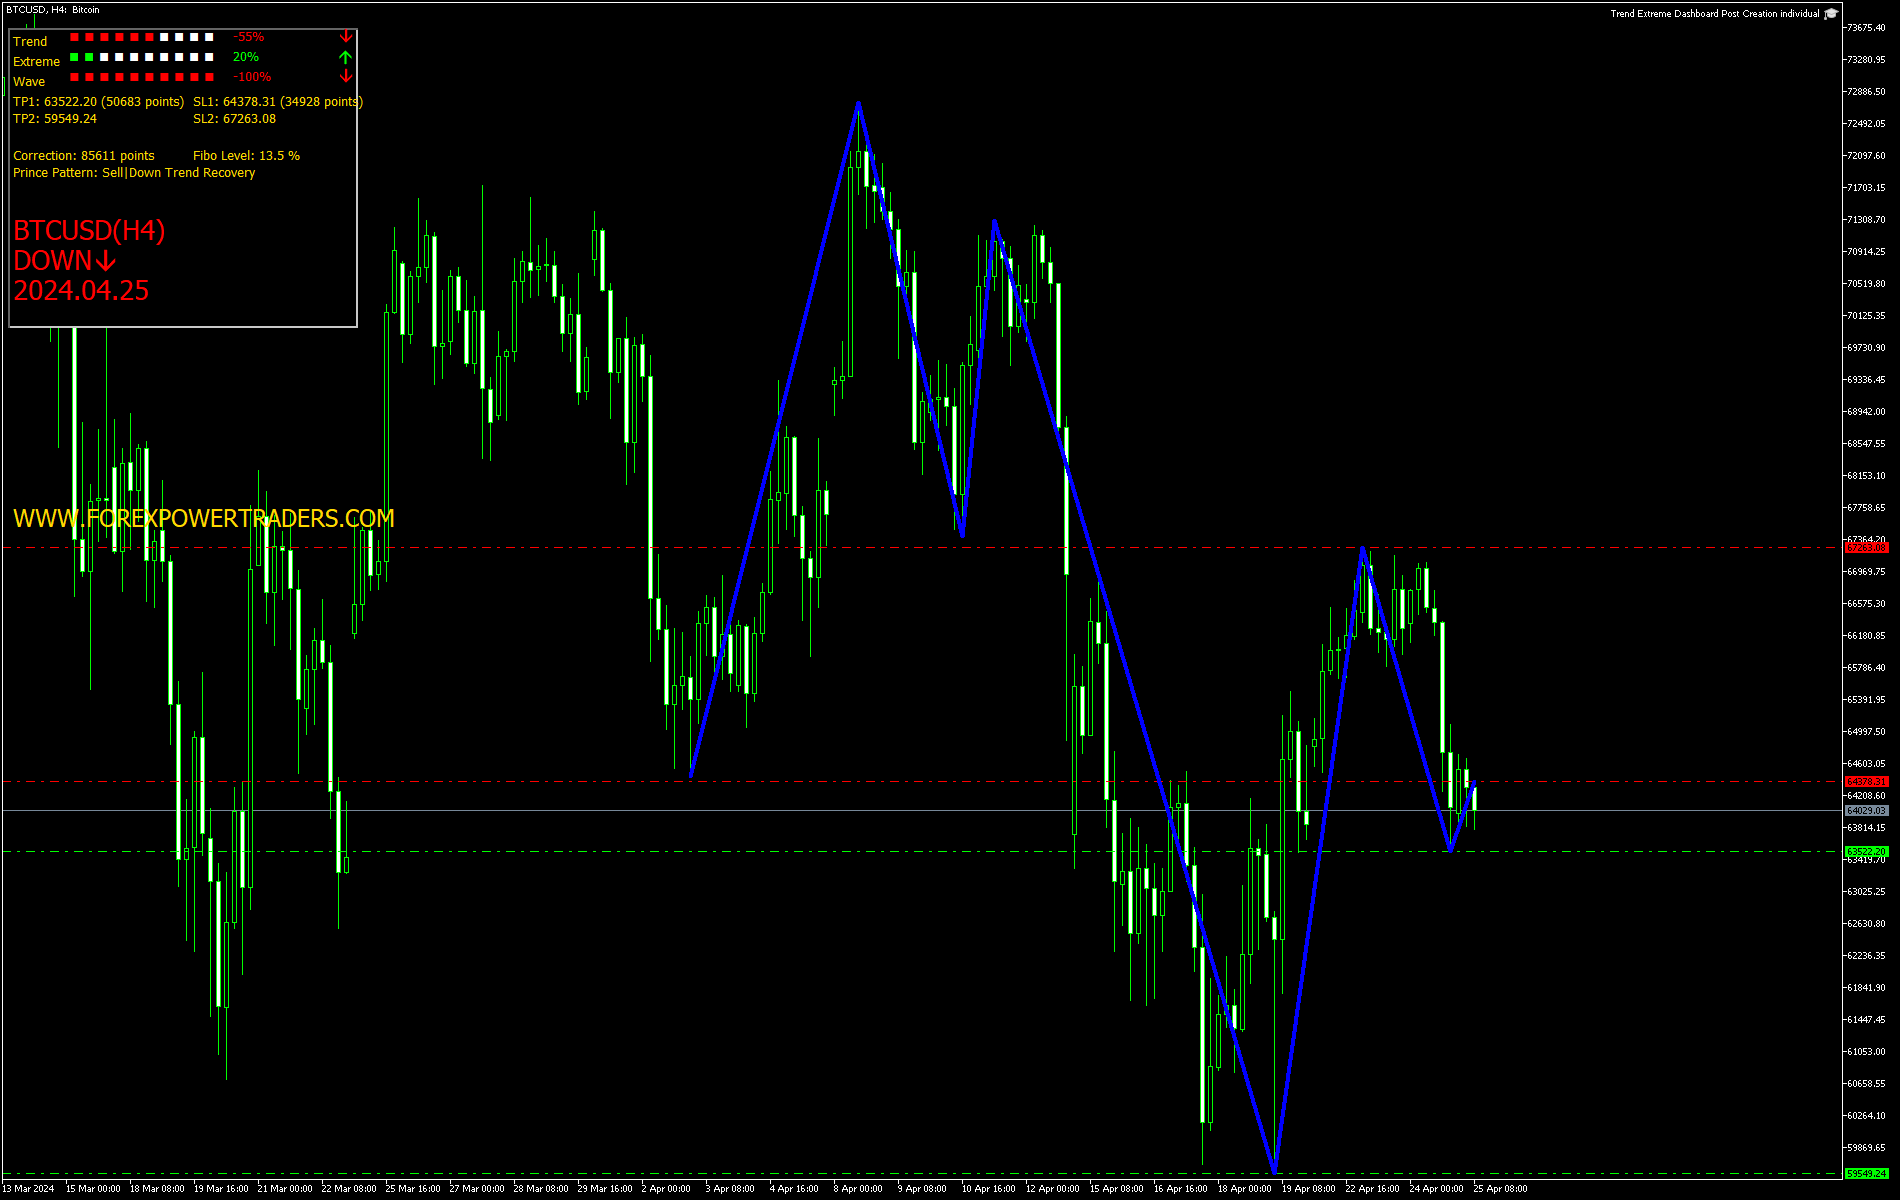
- Trend Bar is Red filled at a level of -55% showing Down trend.
- Wave Bar is Red filled at a level of -100% showing Down momentum.
- Extreme Bar is Overbought Green filled at a level of 20% showing an Up correction that may be finishing.
- Correction so far has been 12.03% 85611 points.
- Possible Take Profit 63522.20/59549.24
- Possible Stop Loss 64378.31/67263.08
ETHUSD Sell (H4)
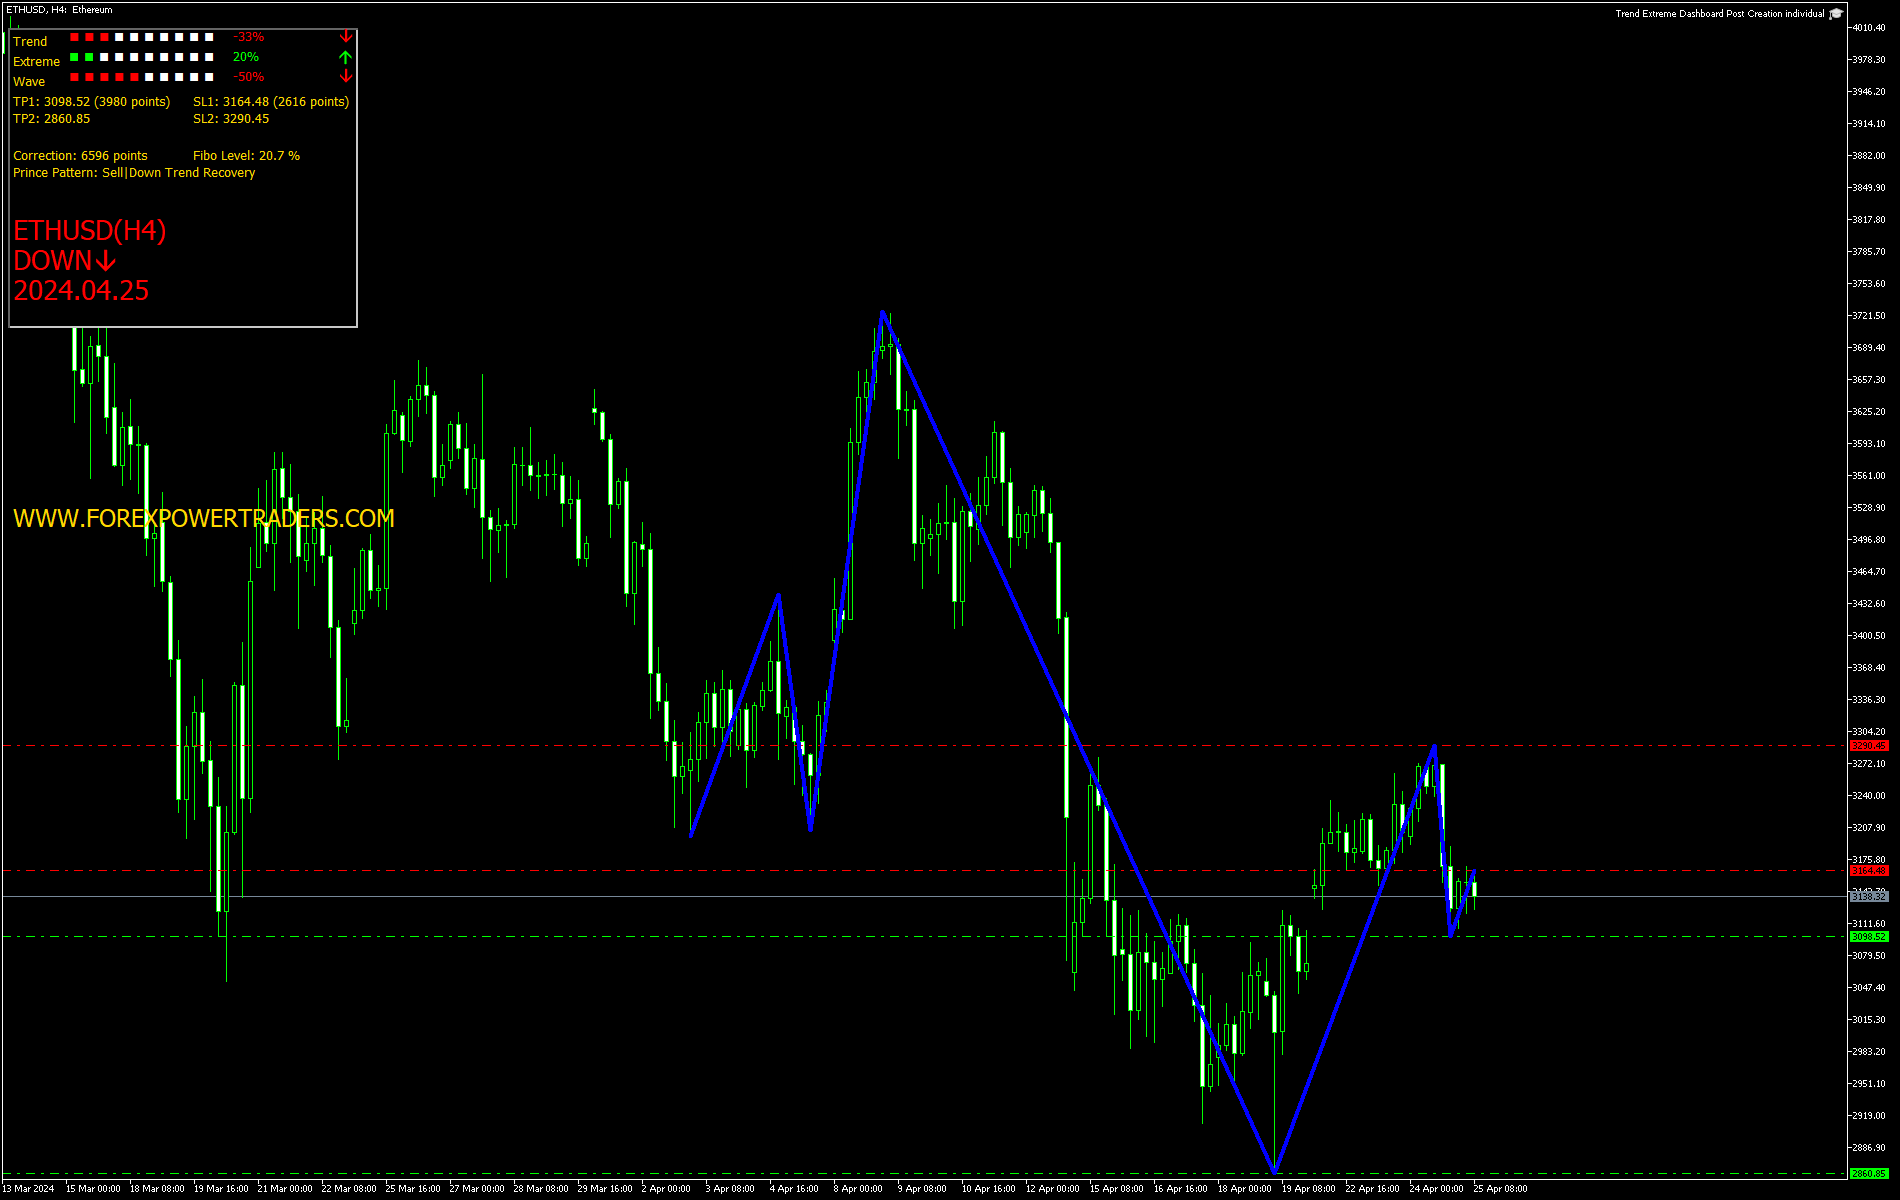
- Trend Bar is Red filled at a level of -33% showing Down trend.
- Wave Bar is Red filled at a level of -50% showing Down momentum.
- Extreme Bar is Overbought Green filled at a level of 20% showing an Up correction that may be finishing.
- Correction so far has been 18.63% 6596 points.
- Possible Take Profit 3098.52/2860.85
- Possible Stop Loss 3164.48/3290.45
NAS100 Sell (H4)
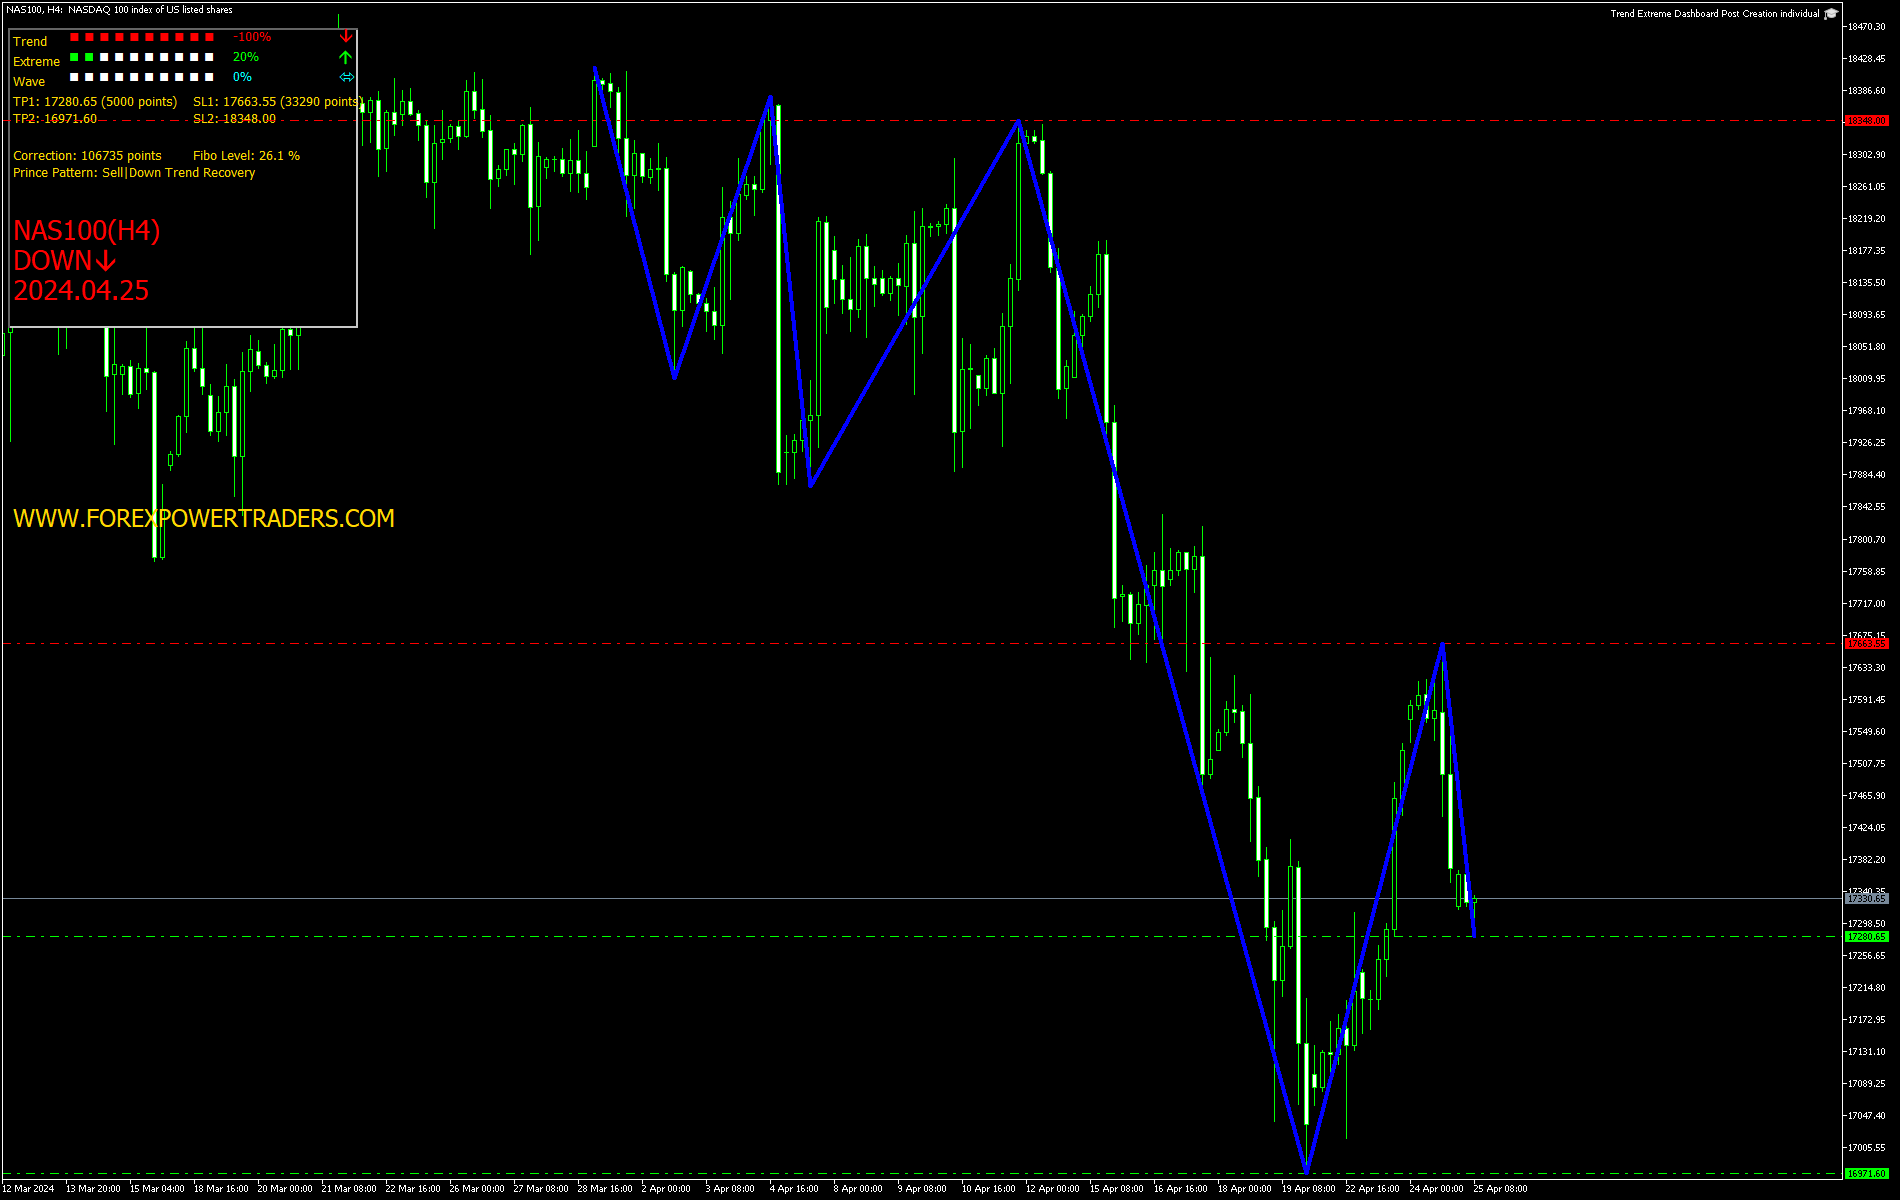
- Trend Bar is Red filled at a level of -100% showing Down trend.
- Wave Bar is Neutral showing the Up correction should be ending
- Extreme Bar is Overbought Green filled at a level of 20% showing an Up correction that may be finishing.
- Correction so far has been 26.01% 106735 points.
- Possible Take Profit 17280.65/16971.60
- Possible Stop Loss 17663.55/18348.00
SPX500 Sell (H4)
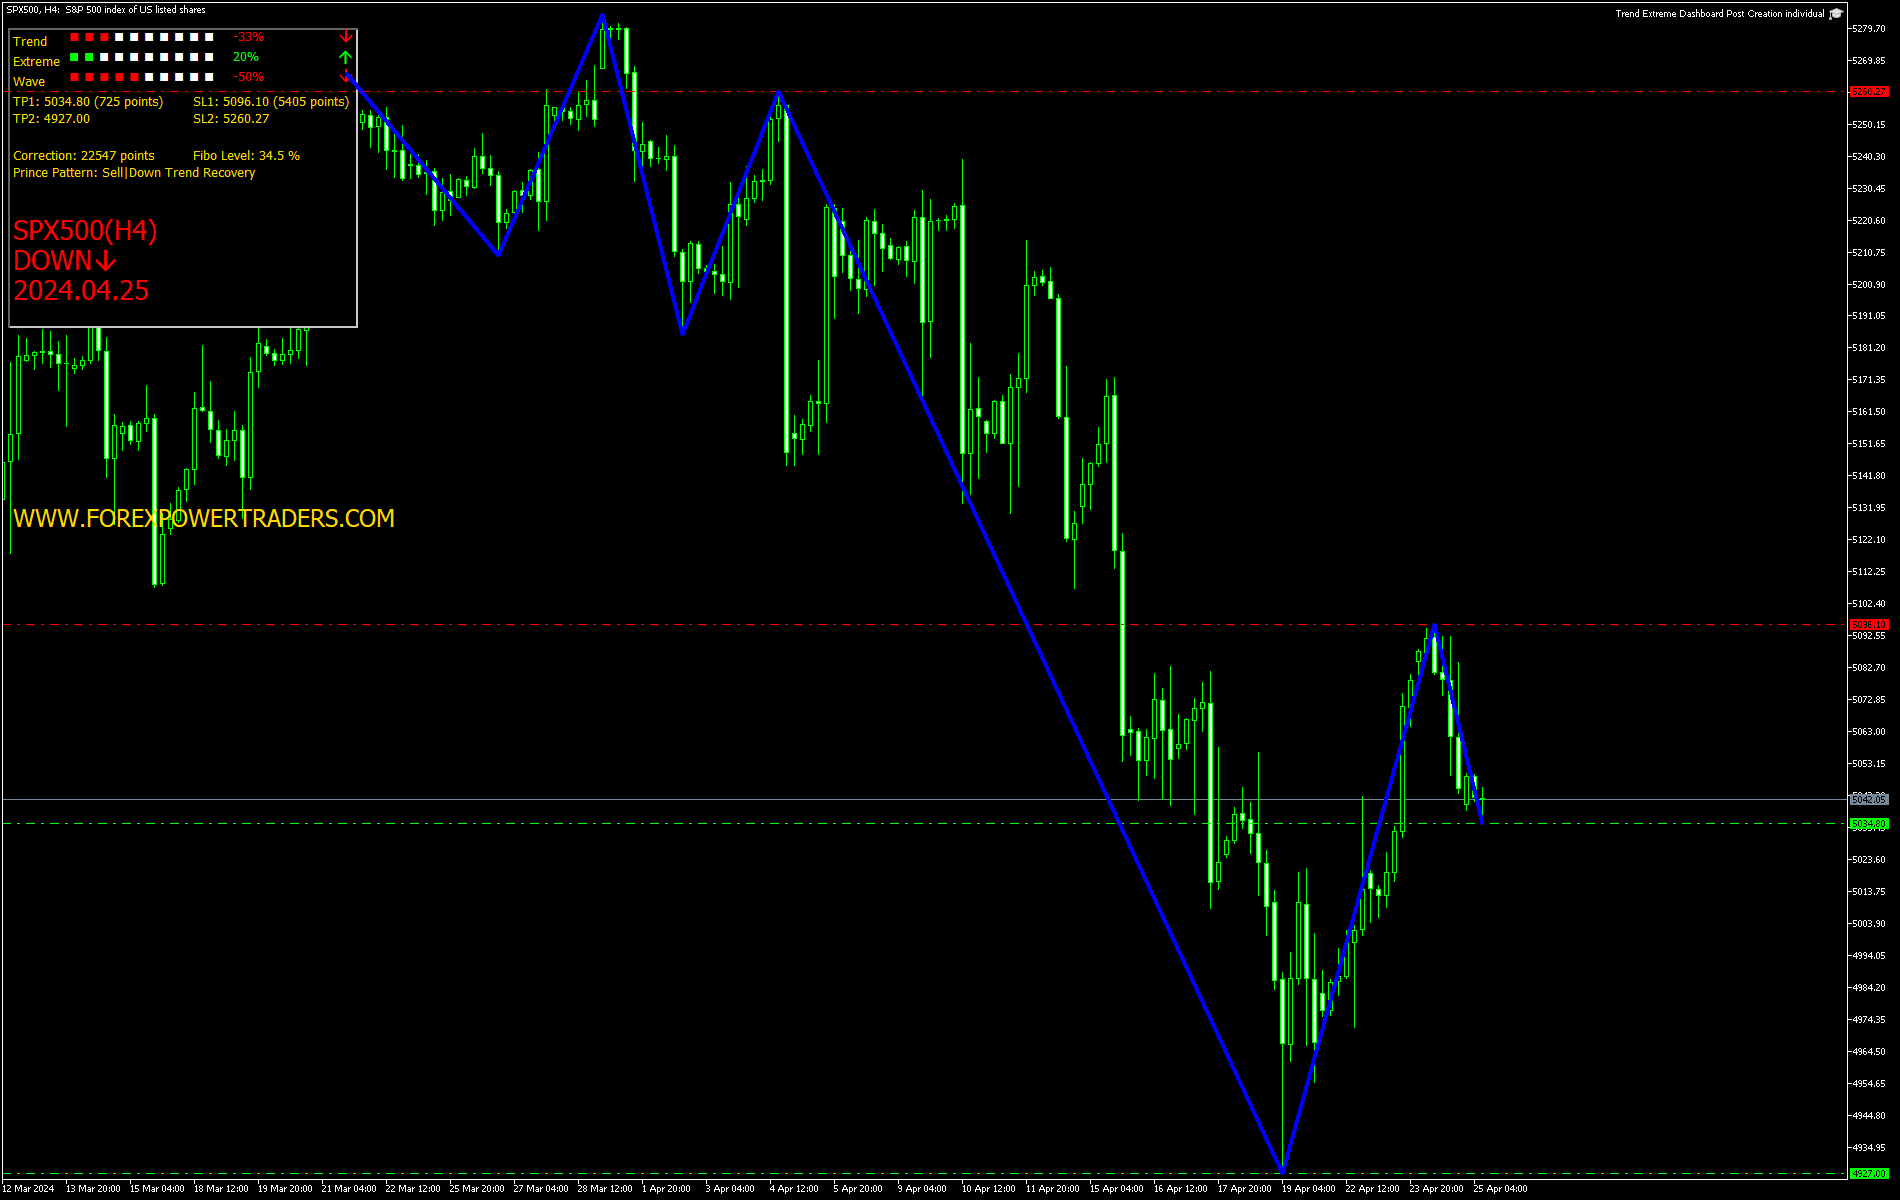
- Trend Bar is Red filled at a level of -33% showing Down trend.
- Wave Bar is Red filled at a level of -50% showing Down momentum.
- Extreme Bar is Overbought Green filled at a level of 20% showing an Up correction that may be finishing.
- Correction so far has been 34.52% 22547 points.
- Possible Take Profit 5034.80/4927.00
- Possible Stop Loss 5096.10/5260.27